
Diaspora vietnamienne
Répartition des émigrés vietnamiens recensés par le Haut Commissariat des Nations Unies pour les réfugiés entre 1975 et 1996 selon les pays ou le territoire de réinstallation
|
Pays ou territoire de réinstallation |
Emigrés vietnamiens entre 1975 et 1996 |
|
|
Nombre d’émigrés |
Pourcentage |
|
|
Etats Unis Canada Australie France Allemagne Royaume-Uni Norvège Pays-Bas Suède Japon Suisse Danemark Nouvelle-Zélande Belgique Finlande Italie Autriche Taiwan Côte d’Ivoire Nouvelle-Calédonie Irlande Hongkong Grèce Luxembourg Islande Sénégal Philippines Espagne Singapour Chine Autres pays |
878,341 162,777 157,729 46,331 28,896 24,240 10,024 9,538 9,091 8,126 7,300 7,004 6,077 5,158 2.601 678 605 263 262 233 203 162 125 56 19 19 11 10 9 0 7,406 |
64.0 11.9 11.5 3.4 2.1 1.8 0.7 0.7 0.7 0.6 0.5 0.5 0.4 0.4 0.2 0.1 0.0 0.0 0.0 0.0 0.0 0.0 0.0 0.0 0.0 0.0 0.0 0.0 0.0 0.0 0.5 |
|
Total |
1,373,389 |
100 |
Source : Statistiques du Haut Commissariat des Nations Unies pour les Réfugiés
Importance numérique des Vietnamiens immigrés en France et aux Etats-Unis
| Catégorie | France |
Etats-Unis |
| Effectifs d’immigrés du Viêt-Nam | 60,329 |
538,604 |
| Population totale du pays | 58,423,000 |
242,012,129 |
| Nombre d’immigrés vietnamiens pour 100,000 habitants | 103.3 |
222.5 |
Bureau of the Census, Etats-Unis, 1990 Census of Population and Housing
Immigrés vietnamiens vietnamiens par région, France, 1990
|
Région |
Immigrés vietnamiens |
||
|
Nombre de personnes |
Proportion (%) |
Pour 100,000 habitants |
|
|
Ile-de-France Provence-Alpes-Côte d’Azur Alsace Champagne-Ardennes Rhônes Alpes Limousin Midi-Pyrénées Languedoc-Roussillon Aquitaine Centre Franche-Comté Lorraine Picardie Bourgogne Pays de la Loire Haute-Normandie Auvergne Poitou-Charentes Bretagne Corse Basse-Normandie Nord-Pas-de-Calais |
30,836 5,090 1,932 1,380 5,250 612 1,838 1,349 1,752 1,354 624 1,268 824 716 1,322 741 560 612 936 76 381 876 |
51.1 8.4 3.2 2.3 8.7 1.0 3.1 2.2 2.9 2.2 1.0 2.1 1.4 1.2 2.2 1.2 0.9 1.0 1.6 0.1 0.6 1.5 |
289.3 119.5 118.9 102.4 98.1 84.7 75.6 63.8 62.7 57.1 56..9 55.0 45.5 44.5 43.2 42.7 42.4 38.4 33.5 30.4 27.4 22.1 |
Sources : INSEE, France, Recensement de la Population de 1990
Plus de la moitié de la communauté vietnamienne réside dans la région Ile-de-France, principalement à Paris (11.8 % du total), en Seine-Saint-Denis (8.2 %), dans le Val-de-Marne (7.4 %), le Val d’Oise (6.7 %) et les Hauts-de-Seine (6.4 %).Immigrés vietnamiens par Etat, Etats-Unis, 1990
|
Etat |
Immigrés vietnamiens |
Etat |
Immigrés vietnamiens |
||||
|
Nombre de personnes |
Proportion (%) |
Pour 100,000 habitants |
Nombre de personnes |
Proportion (%) |
Pour 100,000 habitants |
||
|
California Hawai Washington Texas Virginia Louisiana Oregon Nevada Massachussetts Kansas Colorado Oklahoma Montana Maryland Utah Arizona Pennsylvania Iowa Dist of Columbia Florida New York Connecticut Georgia Michigan Mississipi Illinois |
269,600 5,657 16,329 54,163 19,722 11,286 7,562 2,945 13,173 4,628 5,745 5,307 6,759 7,503 2,288 4,689 13,188 2,886 621 12,337 15,303 2,808 5,464 4,195 2,049 8,757 |
50.1 1.1 3.0 10.1 3.7 2.1 1.4 0.6 2.5 0.9 1.1 1.1 1.3 1.4 0.4 0.9 2.5 0.5 0.1 2.3 2.8 0.5 1.0 0.8 0.4 1.6 |
904.0 509.5 337.7 320.1 316.6 272.0 267.4 245.9 218.8 186.1 175.4 171.7 156.9 156.2 132.0 128.1 111.8 104.2 103.3 95.1 85.5 85.3 84.4 82.4 79.4 77.6 |
New Jersey South California New Mexixo North Carolina Arkansas Minnesota Rhode Island Alabama Maine North Dakota Nebraska Wisconsin Alaska Indiana Delaware Tennessee Ohio Kentucky South Carolina Vermont Idaho Missouri New Hampshire West Virginia Wyoming |
5,842 461 948 4,002 1361 5,283 557 2,238 603 290 721 1,957 206 1,835 216 1,560 3,221 989 798 123 204 130 90 3 0 |
1.1 0.1 .0.2 .0.7 0.3 1.0 0.1 0.4 0.1 0.1 0.1 0.4 0.0 0.3 0.0 0.3 0.6 0.2 0.2 0.0 0.0 0.0 .0 0.0 0.0 |
76.2 67.0 62.9 60.4 58.1 57.4 57.4 55.3 49.4 46.5 45.4 40.0 37.2 33.1 32.5 32.4 29.8 26.6 23.1 23.1 20.4 16.4 8.2 0.2 0.0 |
|
Total |
538,604 |
100 |
217.3 |
||||
Source : Bureau of the Census, Etats Unis, 1990, Census of Population and Housing

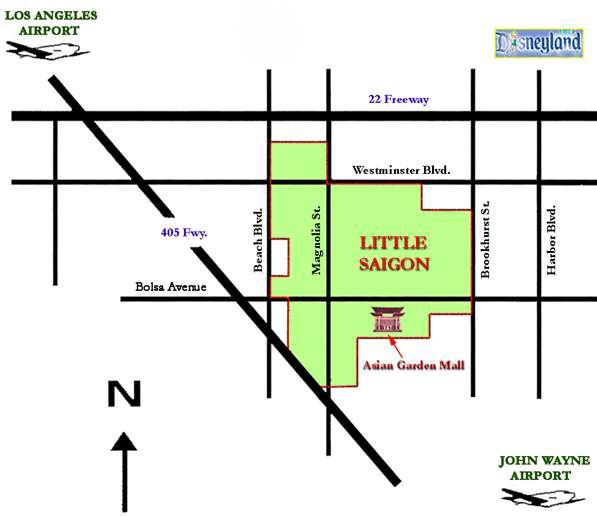
Population d'orgine vietnamienne à Orange County, California
d'après Census Recensement 2000
origine vietnamienne |
total des habitants |
|
| California | 447,032 |
33,871,648 |
| Los Angeles, Riverside, Orange County | 233,573 |
16,373,645 |
| Orange County | 135,548 |
2,846,289 |
| Garden Grove City | 35,406 |
165,196 |
| Westminster City | 27,109 |
88,203 |
| Santa Ana City | 19,226 |
337,977 |
| Anaheim City | 10,025 |
328,014 |
| Fountain Valley | 7,088 |
54,874 |
| Irvine | 4,414 |
143,072 |
Répartition des âges dans la population d'origine vietnamienne
d'après Census Recensement 2000
| Âge / Sexe | Population américaine 281,421,906 |
*** | Population d'origine vietnamienne 1,122,528 |
*** |
| ************** | Nombre | % | Nombre | % |
| Mâle | 138,053,563 | 49.1% | 567,514 | 50.6% |
| Femelle | 143,368,343 | 50.9% | 555,014 | 49.4% |
| En dessous de 19 ans | 80,473,265 | 28.6% | 338,457 | 30.1% |
| De 20 ans à 64 ans | 165,956,888 | 58.9% | 725,830 | 64.7% |
| A partir de 65 ans | 34,991,753 | 12.4% | 58,241 | 5.2% |
2002 : 1,259,730
| Etats |
Code
|
Capitales |
Superficie
|
Immigrés
vietnamiens
|
|
|
mile2
|
km2
|
||||
|
1 California 2 Texas 3 Washington 4 Virginia 5 Massachussetts 6 Florida 7 Pennsylvania 8 Georgia 9 Louisiana 10 New York |
CA TX WA VA MA FL PA GA LA NY |
Sacramento Austin Olympia Richmond Boston Tallahassee Harrisburg Atlanta Baton Rouge Albany |
155,973 261,914 66,582 39,598 7,838 53,937 44,820 57,910 43,566 47,224 |
403,969 678,355 172,447 102,588 20,300 139,696 116,083 149,986 112,836 122,310 |
504,166 152,210 52,047 42,077 38,303 37,432 33,876 32,724 27,471 26,862 |
|
11 Illinois 12 Oregon 13 Minnesota 14 Maryland 15 North Carolina 16 Colorado 17 New Jersey 18 Michigan 19 Arizona 20 Oklahoma |
IL OR MN MD NC CO NJ MI AZ OK |
Springfield Salem Saint Paul Annapolis Ralrigh Denver Trenton Lansing Phoenix Oklahoma City |
55,646 97,060 79,617 9,775 48,718 103,729 7,417 58,110 113,956 68,679 |
144,123 251,384 206,207 25,317 126,179 268,657 19,210 150,504 295,145 177,878 |
21,542 21,304 21,230 18,884 17,589 17,433 17,120 15,421 14,584 14,172 |
|
21 Kansas 22 Missouri 23 Ohio 24 Hawaii 25 Connecticut 26 Iowa 27 Tennessee 28 Nebraska 29 Utah 30 Mississipi |
KS MO OH HI CT IA TN NE UT MS |
Topeka Jefferson City Columbus Honolulu Hartford Des Moines Nashville Lincoln Salt Lake City Jackson |
81,823 68,898 40,952 6,423 4,844 55,875 41,220 76,878 82,168 47,689 |
211,921 178,445 106,065 16,636 12,546 144,716 106,759 199,113 212,814 123,514 |
13,109 11,984 11,066 8,872 8,501 8,040 7,903 7,177 6,731 6,076 |
|
31 Indiana 32 Alabama 33 Nevada 34 South Carolina 35 Arkansas 36 Wisconsin 37 Kentucky 38 New Mexico 39 New Hampshire 40 Idaho |
IN AL NV SC AK WI KY NM NH ID |
Indianapolis Montgomery Carson City Columbia Little Rock Madison Frankfort Sante Fe Concord Boise |
35,870 50,750 109,806 30,111 53,187 56,154 39,732 121,335 8,993 82,751 |
92,903 131,442 284,96 77,987 137,754 145,438 102,905 314,256 23,292 214,324 |
5,462 5,219 4,985 4,791 4,482 4,388 4,056 3,274 1,914 1,492 |
|
41 Maine 42 Vermont 43 Rhode Island 44 Delaware 45 Alaska 46 South Dakota 47 North Dakota 48 Montana 49 Wyoming |
ME VT RI DE AK SD ND MT WY |
Augusta Montpellier Providence Dover Juneau Pierre Bismarck Helena Cheyenne |
30,685 9,249 1,045 1,955 570,374 75,898 68,994 145,556 97,105 |
79,940 23,955 2,707 5,063 1,477,263 196,575 178,694 376,989 251,501 |
1,492 1,105 1,074 921 918 647 539 224 113 |
|
Ranking of
50 U. S. states by vietnamese population
|
Top 50 U.S.
metropolitan areas by vietnamese population
|
|
U.S. CENSUS 2000 1. California - 447,032 2. Texas - 134,961 3. Washington - 46,149 4. Virginia - 37,309 5. Massachusetts - 33,962 6. Florida - 33,190 7. Pennsylvania - 30,037 8. Georgia - 29,016 9. Louisiana - 24,358 10. New York - 23,818 11. Illinois - 19,101 12. Oregon - 18,890 13. Minnesota - 18,824 14. Maryland - 16,744 15. North Carolina - 15,596 16. Colorado - 15,457 17. New Jersey - 15,180 18. Michigan - 13,673 19. Arizona - 12,931 20. Oklahoma - 12,566 21. Kansas - 11,623 22. Missouri - 10,626 23. Ohio - 9,812 24. Hawaii - 7,867 25. Connecticut - 7,538 26. Iowa - 7,129 27. Tennessee - 7,007 28. Nebraska - 6,364 29. Utah - 5,968 30. Mississippi - 5,387 31. Indiana - 4,843 32. Alabama - 4,628 33. Nevada - 4,420 34. South Carolina - 4,248 35. Arkansas - 3,974 36. Wisconsin - 3,891 37. Kentucky - 3,596 38. New Mexico - 3,274 39. New Hampshire - 1,697 40. Idaho - 1,323 40. Maine - 1,323 41. Vermont - 980 42. Rhode Island - 952 43. Delaware - 817 44. Alaska - 814 45. South Dakota - 574 46. North Dakota - 478 47. West Virginia - 379 48. Montana - 199 49. Wyoming - 100 Vietnamese studies internet resources center, http://site.yahoo.com/vstudies/ranof50ussta.html |
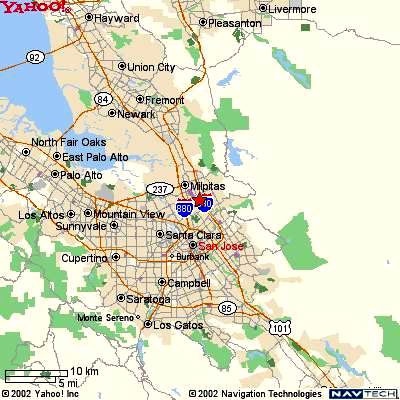
UNITED STATES CENSUS 2000 1. Los Angeles-Riverside-Orange County CA CMSA - 233,573 2. San Francisco-Oakland-San Jose, CA CMSA - 146,613 3. Houston-Galveston-Brazoria, TX CMSA - 63,924 4. Dallas-Fort Worth, TX CMSA - 47,090 5. Washington D.C./VA/MD/WV PMSA - 43,709 6. Seattle-Tacoma-Bremerton CMSA - 40,001 7. San Diego, CA MSA - 33,504 8. Boston-Worcester-Lawrence, MA CMSA - 31,325 9. Philadelphia-Wilmington-Atlantic City, PA/NJ/DE/MD CMSA -24,779 10. Atlanta, GA MSA - 23,996 11. Sacramento-Yolo, CA MSA - 18,170 12. Portland-Salem, OR CMSA - 17,799 13. Minneapolis-St. Paul, MN MSA - 15,905 14. Chicago, IL PMSA - 15,894 15. New Orleans, LA MSA - 14,868 16. Denver-Boulder-Greeley, CO MSA - 13,885 17. New York City, NY PMSA - 12,040 18. Phoenix, AZ MSA - 10,176 19. Oklahoma City, OK MSA - 9,628 20. Tampa-St. Petersburg-Clearwater, FL MSA - 9,318 21. Austin-San Marcos, TX MSA - 8,641 22. Orlando FL, MSA - 7,621 23. Honolulu, HI MSA - 7,392 24. Wichita, KS MSA - 7,284 25. Charlotte-Gastonia-Rock Hill, NC MSA - 6,033 26. Stockton-Lodi, CA MSA - 6,032 27. Grand Rapids-Muskegon-Holland, MI MSA - 5,611 28. Saint Louis, MO-IL MSA - 5,537 29. Salt Lake City-Odgen, UT MSA - 5,531 30. Detroit-Flint-Ann Arbor, MI CMSA - 5,237 31. Kansas City, MO-KS MSA - 5,140 32. Beaumont-Port Arthur, TX MSA - 4,597 33. Biloxi-Gulfport-Pascagoula, MS MSA - 4,264 34. Miami-Fort Lauderdale, FL CMSA - 4,080 35. Greensboro-Winston Salem, NC MSA - 3,782 36. Lincoln, NE MSA - 3,774 37. Baton Rouge, LA MSA - 3,640 38. Baltimore, MD PMSA - 3,616 39. Hartford, CT MSA - 3,590 40. Las Vegas, NV MSA - 3,493 41. Ventura, CA PMSA - 3,308 42. Raleigh-Durham-Chapel Hill MSA - 3,274 43. Memphis, TN MSA - 3,072 44. Richmond-Petersburg, VA MSA - 3,046 45. Norfolk-Virgina Beach-Newport News, VA MSA - 3,044 46. San Antonio, TX MSA - 2,973 47. Harrisburg-Lebanon-Carlisle, PA MSA - 2,649 48. Jacksonville, FL MSA - 2,630 49. Cleveland-Akron, OH CMSA - 2,625 50. Rochester, NY MSA - 2,603
|
Vietnamese communities
The
above map shows U.S. cities with with the highest percentages of people of
Vietnamese ancestry.
VIETNAMESE
In the 2000 census, 1,110,207 people in the U.S.
claimed Vietnamese ancestry.
ePodunk mapped the top communities by percentage of population. The map and the
following list show communities in which 1,000 or more people listed an ancestry
group, and in which at least 2 percent of those people said they were Vietnamese.
| Community |
Place
type |
%
Vietnamese |
| Westminster,
CA |
city |
31.62 |
| Bayou La Batre, AL | city |
23.48 |
| Garden
Grove, CA |
city |
22.11 |
| Henderson,
LA |
town |
15.87 |
| Milpitas,
CA |
city |
13.66 |
| Rosemead,
CA |
city |
13.41 |
| Fountain
Valley, CA |
city |
13.38 |
| Palacios,
TX |
city | 11.82 |
| Avondale, LA | populated place |
11.73 |
| White
Center, WA |
populated place |
10.94 |
| Chamblee,
GA |
city |
10.82 |
| Clarkston,
GA |
city |
10.4 |
| Seven
Corners, VA |
populated place |
9.88 |
| Seadrift,
TX |
city |
9.76 |
| San
Jose, CA |
city |
9.26 |
| Jefferson,
VA |
populated place |
9 |
| Stanton,
CA |
city |
8.33 |
| Morrow,
GA |
city |
8.13 |
| San
Gabriel, CA |
city |
7.99 |
| Lake
City, GA |
city |
7.87 |
| Fulton,
TX |
town |
7.86 |
| Woodlynne,
NJ |
borough |
7.55 |
| Hapeville,
GA |
city |
6.55 |
| Springfield,
VA |
populated place |
6.44 |
| Monterey
Park, CA |
city |
6.41 |
| North
Springfield, VA |
populated place |
6.39 |
| Alhambra,
CA |
city |
6.28 |
| Thunderbolt,
GA |
town |
6.03 |
| Annandale,
VA |
populated place |
6.02 |
| South
San Gabriel, CA |
neighborhd |
5.99 |
| Santa
Ana, CA |
city |
5.89 |
| El
Monte, CA |
city |
5.83 |
| D'Iberville,
MS |
city |
5.77 |
| Florin,
CA |
populated place |
5.39 |
| Doraville,
GA |
city |
5.35 |
| Abbeville, LA | city | 5.04 |
| Port Arthur, TX | city |
4.97 |
| Santa
Clara, CA |
city |
4.93 |
| Woodmere,
LA |
populated place |
4.91 |
| Unalaska,
AK |
city |
4.88 |
| Mission
Bend, TX |
populated place |
4.76 |
| Lawndale,
CA |
city |
4.73 |
| Forest
Park, GA |
city |
4.5 |
| Elk
Grove, CA |
city |
4.47 |
| Barling,
AR |
city |
4.45 |
| Epworth,
IA |
city |
4.2 |
| Lincolnia,
VA |
populated place |
4.14 |
| Baileys
Crossroads, VA |
populated place |
4.12 |
| Winooski,
VT |
city |
3.95 |
| Montclair,
CA |
city |
3.84 |
| Bridge
City, LA |
populated place |
3.78 |
| Harvey,
LA |
populated place |
3.6 |
| Haltom
City, TX |
city |
3.55 |
| Murphy,
TX |
city |
3.55 |
| Biloxi,
MS |
city |
3.5 |
| Union
City, CA |
city |
3.45 |
| Erath,
LA |
town |
3.43 |
| Tustin,
CA |
city |
3.41 |
| Renton,
WA |
city |
3.37 |
| Atlantic
City, NJ |
city |
3.34 |
| Irvine,
CA |
city |
3.31 |
| Saint
Joseph, MN |
township |
3.31 |
| Garland,
TX |
city |
3.25 |
| Stafford,
TX |
city |
3.23 |
| Chantilly,
VA |
populated place |
3.23 |
| Anaheim,
CA |
city |
3.22 |
| Hillandale,
MD |
populated place |
3.18 |
| Telford,
PA |
borough |
3.14 |
| South
El Monte, CA |
city |
3.12 |
| Souderton,
PA |
borough |
3.08 |
| Orange,
CA |
city |
3.06 |
| Lynnwood,
WA |
city |
3.04 |
| Marina,
CA |
city |
3.03 |
| Rockport,
TX |
city |
3.03 |
| Pass
Christian, MS |
city |
3.02 |
| Huntington
Beach, CA |
city |
3.01 |
| Newport
Coast, CA |
populated place |
3 |
| Arlington,
TX |
city |
2.99 |
| Temple
City, CA |
city |
2.95 |
| Brooklyn
Park, MN |
city |
2.95 |
| Lilburn,
GA |
city |
2.93 |
| Worcester,
MA |
city |
2.93 |
| Meadows
Place, TX |
city |
2.91 |
| Riverdale,
GA |
city |
2.89 |
| Springfield,
FL |
city |
2.88 |
| Kenneth
City, FL |
town | 2.82 |
| Estelle, LA | populated place |
2.75 |
| Kentwood,
MI |
city |
2.74 |
| Dunn
Loring, VA |
populated place | 2.74 |
| Empire, LA | populated place |
2.67 |
| Sunnyvale,
CA |
city |
2.64 |
| Silver
Spring, MD |
populated place |
2.64 |
| Foothill
Ranch, CA |
populated place |
2.61 |
| Chelsea,
MA |
city |
2.57 |
| Lake
Forest, CA |
city |
2.55 |
| Garden
City, KS |
city |
2.55 |
| Gretna,
LA |
city |
2.55 |
| Malden,
MA |
city |
2.55 |
| Newcastle,
WA |
city |
2.55 |
| Campbell,
CA |
city |
2.54 |
| Gardena,
CA |
city |
2.54 |
| Glendale Heights, IL | village |
2.53 |
| Olympia,
WA |
city |
2.53 |
| Federal
Heights, CO |
city |
2.51 |
| West
Covina, CA |
city |
2.49 |
| Pennsauken,
NJ |
township |
2.47 |
| Randolph,
MA |
town |
2.46 |
| Hatfield,
PA |
borough |
2.46 |
| West
Springfield, VA |
populated place |
2.46 |
| Oakland,
CA |
city |
2.42 |
| San
Diego, CA |
city |
2.42 |
| Bay
Point, CA |
populated place |
2.4 |
| White
Oak, MD |
populated place |
2.39 |
| Rosemont,
CA |
populated place |
2.38 |
| Stockton,
CA |
city |
2.36 |
| Aloha,
OR |
populated place |
2.36 |
| East
Lansdowne, PA |
borough |
2.36 |
| Homestead,
PA |
borough |
2.35 |
| Pelican
Rapids, MN |
city |
2.32 |
| Seattle,
WA |
city |
2.31 |
| Terrytown,
LA |
populated place |
2.3 |
| Waco,
KS |
township |
2.28 |
| Placentia,
CA |
city |
2.27 |
| North
Kansas City, MO |
city |
2.23 |
| Carrollton,
TX |
city |
2.23 |
| Pflugerville,
TX |
city |
2.22 |
| Laguna,
CA |
populated place |
2.2 |
| Fort
Smith, AR |
city |
2.19 |
| Fremont,
CA |
city |
2.19 |
| Marrero,
LA |
populated place |
2.18 |
| Tukwila,
WA |
city |
2.18 |
| Highland,
CA |
city |
2.17 |
| Hatfield,
PA |
township |
2.17 |
| SeaTac,
WA |
city |
2.17 |
| Portland,
OR |
city |
2.16 |
| San
Pablo, CA |
city |
2.14 |
| Larose,
LA |
populated place |
2.14 |
| Hayward,
CA |
city |
2.13 |
| Liberal,
KS |
city |
2.13 |
| Alameda,
CA |
city |
2.12 |
| Calverton,
MD |
populated place |
2.12 |
| Happy
Valley, OR |
city |
2.12 |
| Sugar
Land, TX |
city |
2.12 |
| Costa
Mesa, CA |
city |
2.11 |
| Wichita,
KS |
city |
2.11 |
| Quincy,
MA |
city |
2.1 |
| Burke,
VA |
populated place |
2.1 |
| Burien,
WA |
city |
2.1 |
| Newark,
CA |
city |
2.09 |
| Wyoming,
MI |
city |
2.09 |
| Norcross,
GA |
city |
2.07 |
| Richardson,
TX |
city |
2.07 |
| Cerritos,
CA |
city |
2.03 |
| Gainesville,
GA |
city |
2.03 |
| Grand
Prairie, TX |
city |
2.03 |
| New
Holland, PA |
borough |
2.02 |
| Tacoma,
WA |
city |
2.02 |
| Crete,
NE |
city |
2.01 |
| Fairfax,
VA |
city |
2.01 |
Sources:
2000
Census, U.S.
Census Bureau; Harvard Encyclopedia of American Ethnic Groups, ed. Stephan
Thernstrom; Ancestry:
2000, U.S. Census
Bureau (June 2004); We
the People: Asians in the United States,
U.S. Census Bureau (December 2004); ePodunk
Mapping by Daniel Shorter
-- November 2005